Difference between revisions of "Template:Largest metropolitan areas of Canada"
Jump to navigation
Jump to search
imported>Moka Mo |
imported>Moka Mo |
||
| Line 10: | Line 10: | ||
| city_1 = Toronto | div_1 = Ontario | pop_1 = 5,928,040 | img_1 = Toronto_Skyline_September_2014.jpg | | city_1 = Toronto | div_1 = Ontario | pop_1 = 5,928,040 | img_1 = Toronto_Skyline_September_2014.jpg | ||
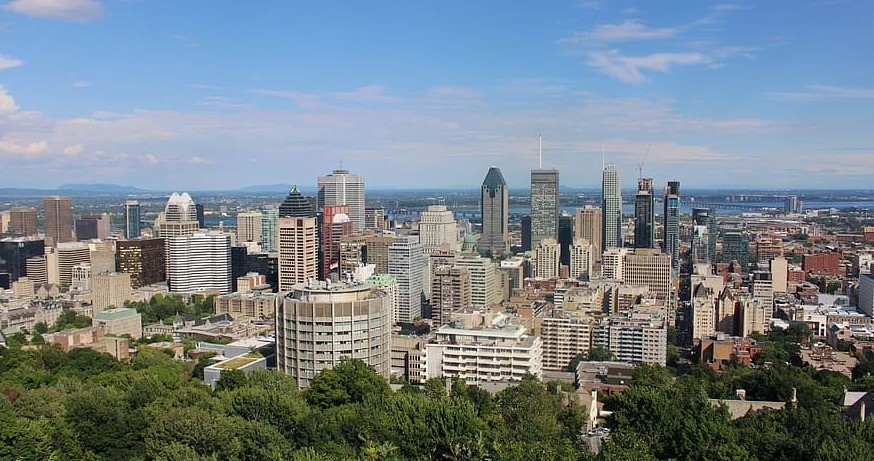
| city_2 = Montreal | div_2 = Quebec | pop_2 = 4,098,927 | img_2 = Montreal-canada-parc-urban.jpg | | city_2 = Montreal | div_2 = Quebec | pop_2 = 4,098,927 | img_2 = Montreal-canada-parc-urban.jpg | ||
| − | | city_3 = Vancouver | div_3 = British Columbia | pop_3 = 2,463,431 | img_3 = | + | | city_3 = Vancouver | div_3 = British Columbia | pop_3 = 2,463,431 | img_3 = Concord Pacific Master Plan Area.jpg |
| − | | city_4 = Calgary | div_4 = Alberta | pop_4 = 1,392,609 | img_4 = | + | | city_4 = Calgary | div_4 = Alberta | pop_4 = 1,392,609 | img_4 = Calgary_Skyline_May_2018_(cropped).jpg |
| city_5 = Ottawa{{Square bracket close|2}}–{{Square bracket open|2}}Gatineau | div_5 = Ontario{{Square bracket close|2}}–{{Square bracket open|2}}Quebec | pop_5 = 1,323,783 | | city_5 = Ottawa{{Square bracket close|2}}–{{Square bracket open|2}}Gatineau | div_5 = Ontario{{Square bracket close|2}}–{{Square bracket open|2}}Quebec | pop_5 = 1,323,783 | ||
| city_6 = Edmonton | div_6 = Alberta | pop_6 = 1,321,426 | | city_6 = Edmonton | div_6 = Alberta | pop_6 = 1,321,426 | ||
Revision as of 23:59, 10 March 2020
| Rank | Province | Pop. | Rank | Province | Pop. | ||||
|---|---|---|---|---|---|---|---|---|---|
 Toronto  Montreal |
1 | Toronto | Ontario | 5,928,040 | 11 | London | Ontario | 494,069 |  Vancouver  Calgary |
| 2 | Montreal | Quebec | 4,098,927 | 12 | St. Catharines–Niagara | Ontario | 406,074 | ||
| 3 | Vancouver | British Columbia | 2,463,431 | 13 | Halifax | Nova Scotia | 403,390 | ||
| 4 | Calgary | Alberta | 1,392,609 | 14 | Oshawa | Ontario | 379,848 | ||
| 5 | Ottawa–Gatineau | Ontario–Quebec | 1,323,783 | 15 | Victoria | British Columbia | 367,770 | ||
| 6 | Edmonton | Alberta | 1,321,426 | 16 | Windsor | Ontario | 329,144 | ||
| 7 | Quebec City | Quebec | 800,296 | 17 | Saskatoon | Saskatchewan | 295,095 | ||
| 8 | Winnipeg | Manitoba | 778,489 | 18 | Regina | Saskatchewan | 236,481 | ||
| 9 | Hamilton | Ontario | 747,545 | 19 | Sherbrooke | Quebec | 212,105 | ||
| 10 | Kitchener–Cambridge–Waterloo | Ontario | 523,894 | 20 | St. John's | Newfoundland and Labrador | 205,955 | ||
References
- ↑ "Statistical Area Classification - Variant of SGC 2016 (Census metropolitan area and census agglomeration)". Statistics Canada. November 16, 2016. Archived from the original on November 16, 2016. Retrieved November 16, 2016.
There are 35 CMAs and 117 CAs in 2016. Two new CMAs were created: Belleville (Ont.) and Lethbridge (Alta.). Eight new CAs were created: Gander (N.L.), Sainte-Marie (Que.), Arnprior (Ont.), Carleton Place (Ont.), Wasaga Beach (Ont.), Winkler (Man.), Weyburn (Sask.) and Nelson (Alta.). The CAs of Amos (Que.) and Temiskaming Shores (Ont.) were retired because the population of their cores dropped below 10,000 in 2011.