Template:2018 Trento provincial election
Jump to navigation
Jump to search
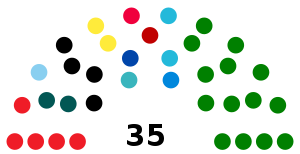
| Candidates | Votes | % | Seats | Parties | Votes | % | Seats | ||
|---|---|---|---|---|---|---|---|---|---|
| Maurizio Fugatti | 124,590 | 46.74 | 1 | ||||||
| League | 69,116 | 27.09 | 13 | ||||||
| Civic Trentino | 11,777 | 4.62 | 2 | ||||||
| Trentino Project | 8,248 | 3.23 | 1 | ||||||
| Popular Autonomists | 7,621 | 2.99 | 1 | ||||||
| Forza Italia | 7,204 | 2.82 | 1 | ||||||
| Act for Trentino | 5,458 | 2.14 | 1 | ||||||
| bgcolor="Template:Union of the Centre (2002)/meta/color" | | UDC–People's Centre | 5,306 | 2.08 | – | |||||
| Brothers of Italy | 3,686 | 1.44 | – | ||||||
| Fassa Association | 2,490 | 0.98 | 1 | ||||||
| Total | 120,906 | 47.39 | 20 | ||||||
| Giorgio Tonini | 67,712 | 25.40 | 1 | ||||||
| Democratic Party | 35,530 | 13.93 | 4 | ||||||
| Futura 2018 | 17,670 | 6.93 | 2 | ||||||
| bgcolor="Template:Union for Trentino/meta/color" | | Union for Trentino | 10,150 | 3.98 | 1 | |||||
| Total | 63,350 | 24.83 | 7 | ||||||
| bgcolor="Template:Trentino Tyrolean Autonomist Party/meta/color"| | Ugo Rossi | 33,121 | 12.42 | 1 | bgcolor="Template:Trentino Tyrolean Autonomist Party/meta/color"| | Trentino Tyrolean Autonomist Party | 32,109 | 12.59 | 3 |
| Filippo Degasperi | 18,922 | 7.10 | 1 | Five Star Movement | 18,437 | 7.23 | 1 | ||
| Antonella Valer | 7,099 | 2.66 | – | ||||||
| Free and Equal | 3,560 | 1.40 | – | ||||||
| bgcolor="Template:The Other Europe/meta/color" | | Other Trentino on the Left | 2,101 | 0.82 | – | |||||
| Total | 5,661 | 2.22 | – | ||||||
| Mauro Ottobre | 5,237 | 1.96 | – | Dynamic Autonomy | 5,117 | 2.01 | – | ||
| Roberto de Laurentis | 4,015 | 1.51 | – | Territoriality Responsibility Economics | 3,826 | 1.50 | – | ||
| Paolo Primon | 2,384 | 0.89 | – | Free People – Freie Völker | 2,285 | 0.90 | – | ||
| Ferruccio Chenetti | 1,904 | 0.71 | – | Movement Ladin Fassa | 1,890 | 0.74 | – | ||
| Filippo Castaldini | 1,247 | 0.47 | – | CasaPound Italy | 1,215 | 0.48 | – | ||
| Federico Monegaglia | 350 | 0.13 | – | Reconquer Italy | 341 | 0.13 | – | ||
| Total candidates | 266,581 | 100 | 4 | Total parties | 255,137 | 100 | 31 | ||
| Source: Autonomous Province of Trento | |||||||||
