Template:Infobox U.S. congressional district/testcases
Jump to navigation
Jump to search
| This is the template test cases page for the sandbox of Template:Infobox U.S. congressional district. Script error: No such module "Purge". to update the examples. If there are many examples of a complicated template, later ones may break due to limits in MediaWiki, see the HTML comment "NewPP limit report" in the rendered page. You can also use Special:ExpandTemplates to examine the results of template uses. You can test how this page looks in the different skins with these links: |
| Alabama's 1st congressional district | ||||||||||||||||||||||||||||||||||||||||||||||||
|---|---|---|---|---|---|---|---|---|---|---|---|---|---|---|---|---|---|---|---|---|---|---|---|---|---|---|---|---|---|---|---|---|---|---|---|---|---|---|---|---|---|---|---|---|---|---|---|---|
| ||||||||||||||||||||||||||||||||||||||||||||||||
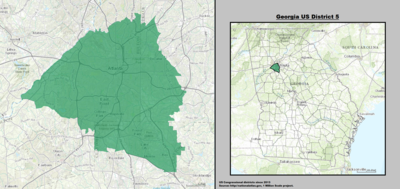
| Georgia's 5th congressional district | ||||||||||||||||||||||||||||||||||||||||
|---|---|---|---|---|---|---|---|---|---|---|---|---|---|---|---|---|---|---|---|---|---|---|---|---|---|---|---|---|---|---|---|---|---|---|---|---|---|---|---|---|
| ||||||||||||||||||||||||||||||||||||||||
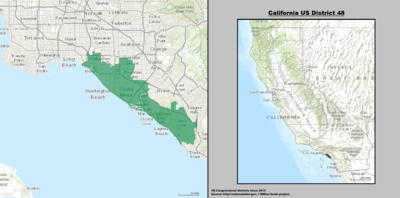
| California's 48th congressional district | ||||||||||||||||||||||||||||||||
|---|---|---|---|---|---|---|---|---|---|---|---|---|---|---|---|---|---|---|---|---|---|---|---|---|---|---|---|---|---|---|---|---|
| ||||||||||||||||||||||||||||||||
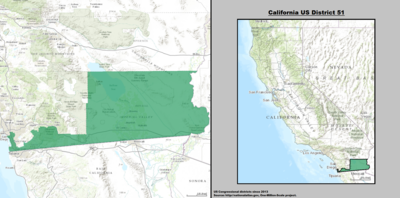
| California's 51st congressional district | ||||||||||||||||||||||||||||||||||||||||
|---|---|---|---|---|---|---|---|---|---|---|---|---|---|---|---|---|---|---|---|---|---|---|---|---|---|---|---|---|---|---|---|---|---|---|---|---|---|---|---|---|
| ||||||||||||||||||||||||||||||||||||||||
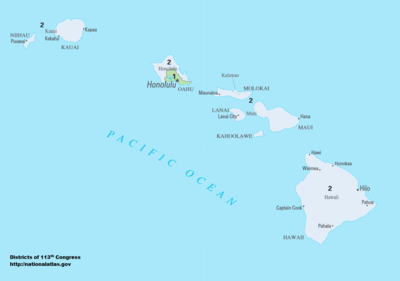
| Hawaii's 1st congressional district | ||||||||||||||||||||||||||||||||||||||||
|---|---|---|---|---|---|---|---|---|---|---|---|---|---|---|---|---|---|---|---|---|---|---|---|---|---|---|---|---|---|---|---|---|---|---|---|---|---|---|---|---|
| ||||||||||||||||||||||||||||||||||||||||
References
- ↑ https://www.census.gov/geo/maps-data/data/cd_state.html
- ↑ 2.0 2.1 Center for New Media & Promotion (CNMP), US Census Bureau. "My Congressional District". www.census.gov.
- ↑ https://www.census.gov/geo/maps-data/data/cd_state.html
- ↑ "Partisan Voting Index – Districts of the 115th Congress" (PDF). The Cook Political Report. April 7, 2017. Retrieved April 7, 2017.
- ↑ Geography, US Census Bureau. "Congressional Districts Relationship Files (state-based)". www.census.gov.
- ↑ Bureau, Center for New Media & Promotion (CNMP), US Census. "My Congressional District". www.census.gov.
- ↑ https://www.census.gov/mycd/?st=13&cd=05
- ↑ 8.0 8.1 8.2 8.3 "Partisan Voting Index – Districts of the 115th Congress" (PDF). The Cook Political Report. April 7, 2017. Retrieved April 7, 2017.
- ↑ US Census
- ↑ LA Times
- ↑ "American Fact Finder - Results". United States Census Bureau. Archived from the original on February 13, 2020. Retrieved May 20, 2015.
- ↑ US Census
- ↑ LA Times
- ↑ "My Congressional District". United States Census Bureau. Retrieved December 28, 2018.


